
The BigDataStack Data Visualization Service built on Open Source Software
In this series, BigDataStack is taking each of its six services under the looking glass, highlighting its software components, their functionalities and place in the BigDataStack infrastructure management. Each service consists of a set of software components that allow for specific Big Data applications and operations, that will be showcased. For you, to have a quick understanding of the added value of the BigDataStack software for your own business, BigDataStack partners have prepared a series of videos. We kick this series off with the BigDataStack Data Visualisation Service.
Adaptable Visualisations Software Component in the Data Visualisation Service
The BigdataStack Data Visualization service goes beyond the presentation of data and analytics outcomes to adaptable visualisations in an automated way. The main component of this service is the Adaptable Visualisations.
Adaptable Visualizations presents graphs and reports of data and analytics outcomes in an adaptive and interactive way. Based on the form and the size of the data, different visualizations are dynamically presented. Performance aspects such as data sources information, data operations outcomes, computing, storage and networking infrastructure data are visualized. It also provides a multi-view unified and structured User Interface that either consumes or integrates various BigDataStack components.
A complete view of the data for the connected consumer, real-time shipping and smart insurance
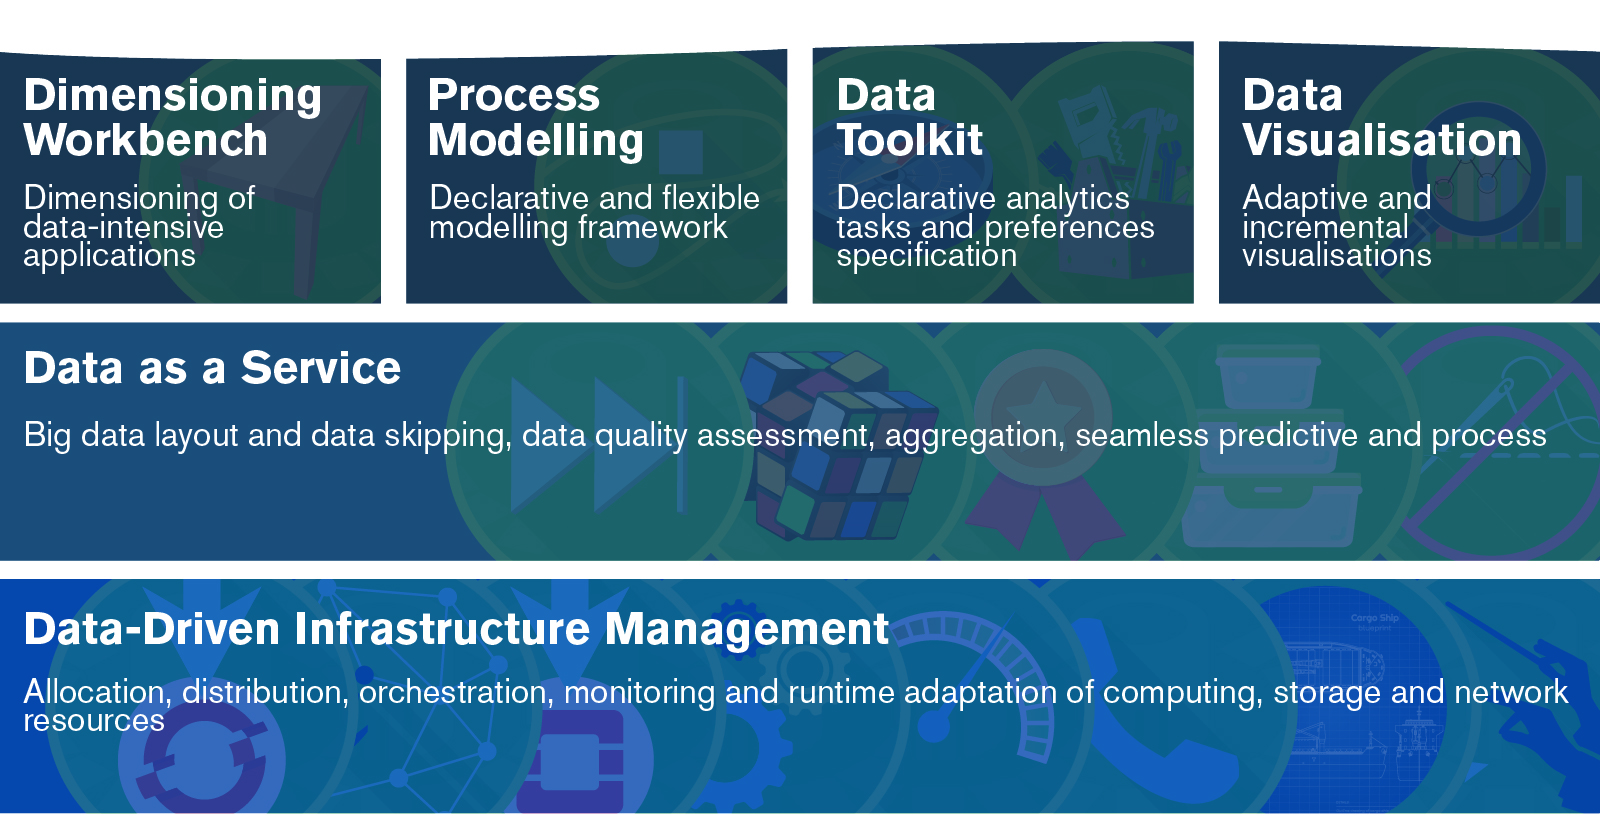
Adaptable Visualizations software is used in all three use cases of BigDataStack, providing a complete view of the data for the connected consumer, real-time shipping and smart insurance. An end to end scenario has been implemented to test the component’s role in the use cases. Following this scenario, a high-level graph is produced by the business analyst using Process Modeller Component:
-
The generated graph is propagated to the Data Analyst who extracts a playbook by invoking the Data Toolkit Component.
-
This playbook is later on consumed by the Application Dimensioning Workbench API and a recommendation can be deployed and monitored.
-
Application has access to performance metrics and Quality of Service violation alarms and respective actions taken by the Dynamic Orchestrator Component.
Adaptable Visualizations built on Open Source
BigDataStack technology provider ATC developed the Adaptable Visualizations component based on Open Source software JWT, Docker Compose, Kubernetes. ATC already applied in commercial products addressing the data needs of media companies, but also large enterprises.
Watch the video and learn more: